Analyst
Educators understand and use data to drive their instruction and support students in achieving their learning goals.
Research and Reference Pie Chart
| graph.pdf |
Ashley created this pie chart using Create A Graph to gather data on her students favorite desserts.
Poll Everywhere
Ashley created this digital poll to survey people on their likeliness to refer a particular business to their friends. Data is collected and used to improve business practices.
Rubric
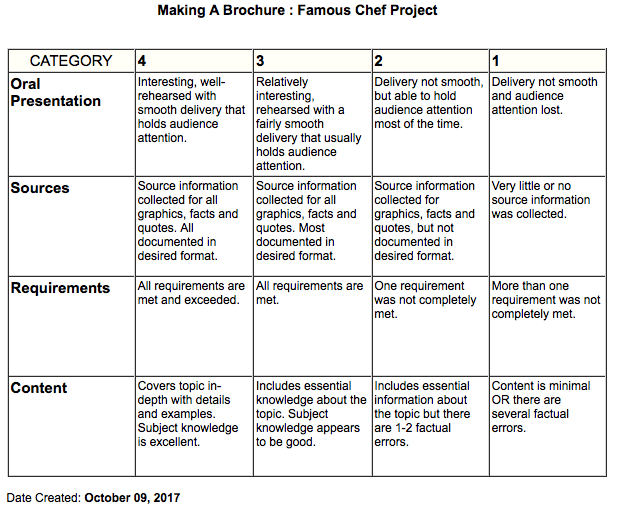
Ashley created this rubric as a means for grading a famous chef project using RubiStar.
Resources
- Create a Graph - Create a Graph allows you to create various graphs and charts for collecting and analyzing date on a particular subject.
- PollEverywhere - PollEverywhere is live, interactive way to poll your audience and collect data on a subject.
- RubiStar - RubiStar is a site that can be used to generate rubrics for grading projects.
